Tech That Talks to You
Give your code a voice. Let your tools reveal what’s under the surface — performance issues, complexity, memory usage, and maintainability insights.
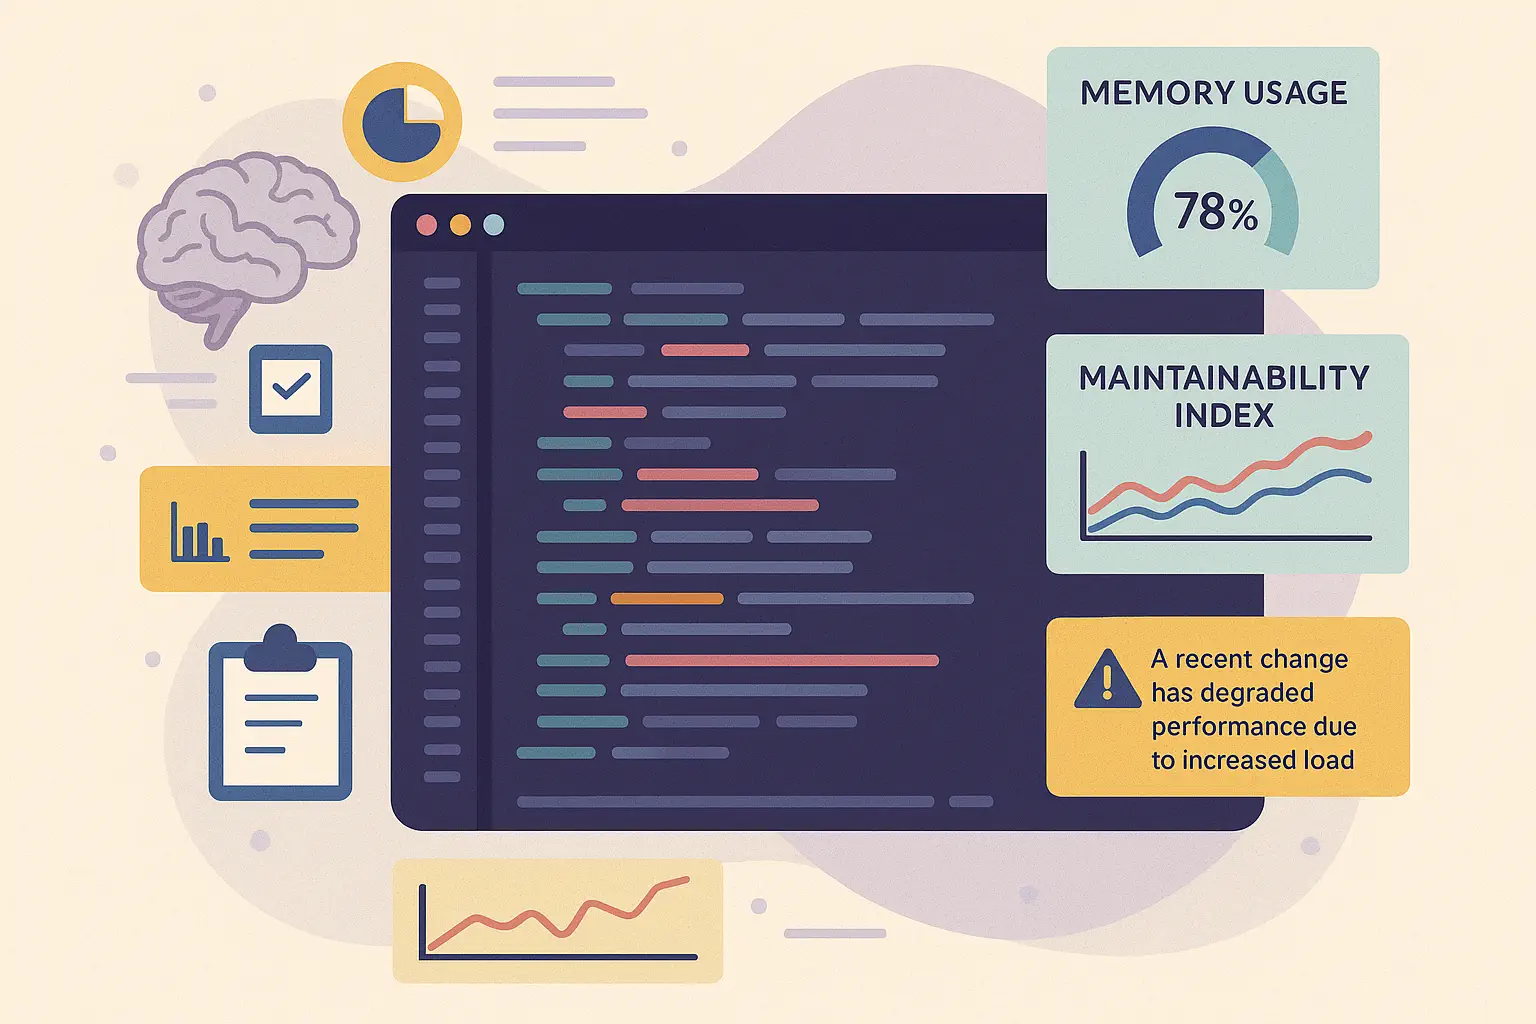
Developer Metrics That Matter
Tools help you measure what really impacts quality, scalability, and future maintenance. Here's what to track:
| Metric | What It Shows | Why It Matters |
|---|---|---|
| Memory Usage | Live and peak RAM usage | Spot leaks or inefficient data structures |
| CPU Time | How long functions take to run | Diagnose slow operations and loops |
| Cyclomatic Complexity | Number of decision paths in code | Keep logic testable and modular |
| Maintainability Index | Code readability + effort to change | Reduce tech debt over time |
| SQL Query Time | Database latency under real load | Prevent production bottlenecks |
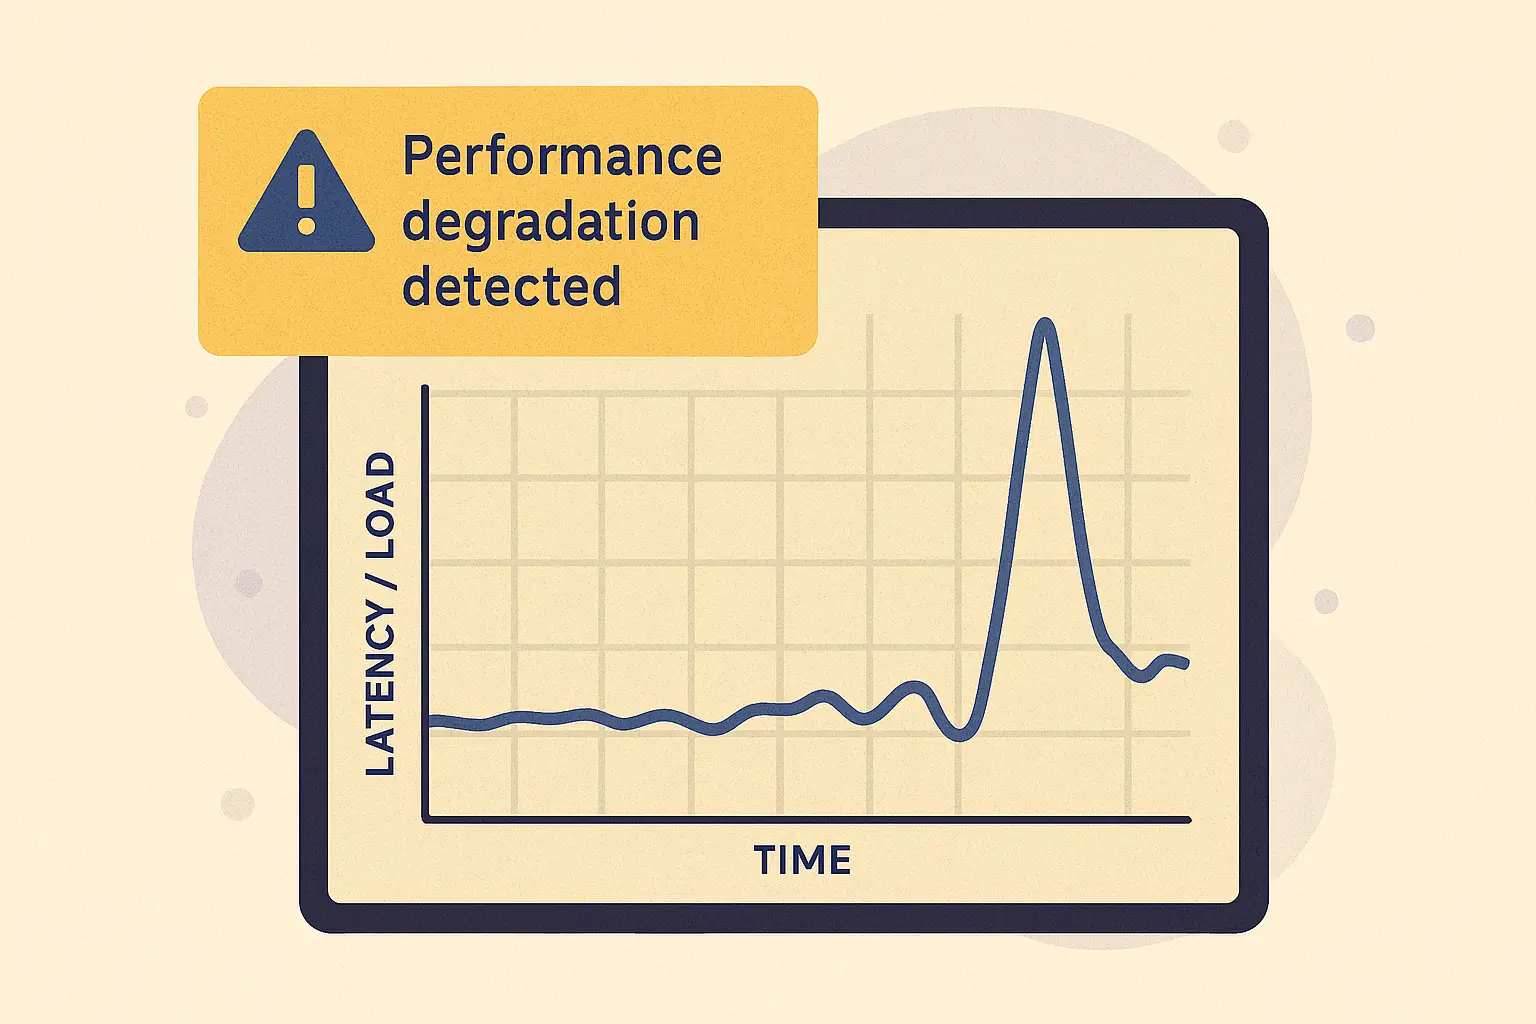
When 10ms Becomes a Disaster
A loop added 10ms per item to a pricing API call. It passed local QA. But under 50,000 concurrent users browsing 40 items each, it triggered 2 million calls, maxed out CPUs, and crashed the app.
Profilers and load simulators revealed the risk. Fix? Response caching and request batching.
Tools That Help Code Speak
Performance Profilers
Reveal hot paths, memory leaks, and GC spikes before your users do.
Static Code Analyzers
Scan for complexity, code smells, and refactoring opportunities.
Maintainability Scanners
Predict long-term effort needed to support and evolve your codebase.
Slow SQL? Read This First
- Use EXPLAIN PLAN to diagnose full table scans
- Index selectively — not every column helps
- Avoid SELECT * — keep queries lean
- Paginate with LIMIT to avoid memory floods
- Parameterize queries to improve cache reuse
- Watch slow query logs in staging regularly
- Break heavy jobs into async batches
- Use joins wisely — avoid Cartesian products
Your Tools Are Talking
Let them help you catch what code alone can't say. Explore our Developer 101 blogs and start coding with confidence, insight, and foresight.
Read Developer 101